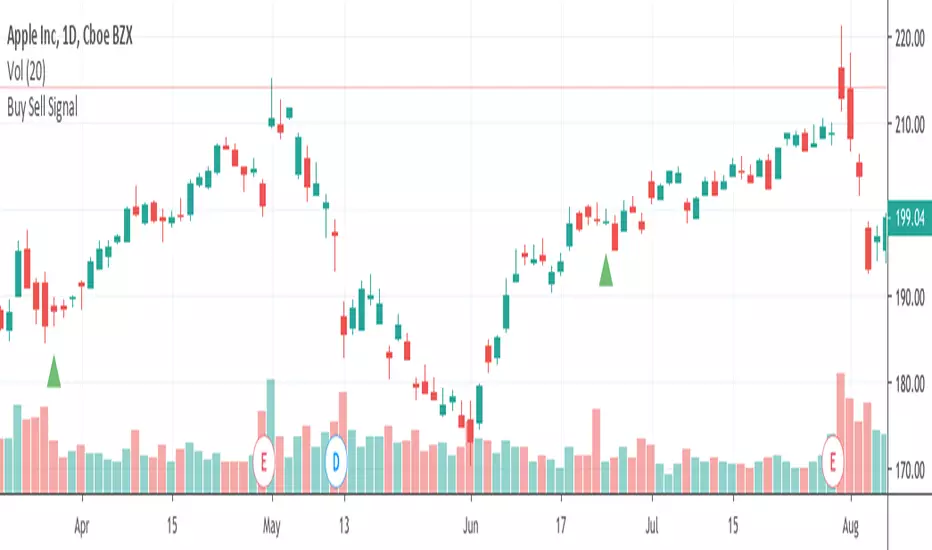
Buy Sell Signals 2Finding the highest winning percentage trade
Work best on stock (1D time frame)
Only available for a month.
If you like it, please message me
ابحث في النصوص البرمجية عن "Buy sell"

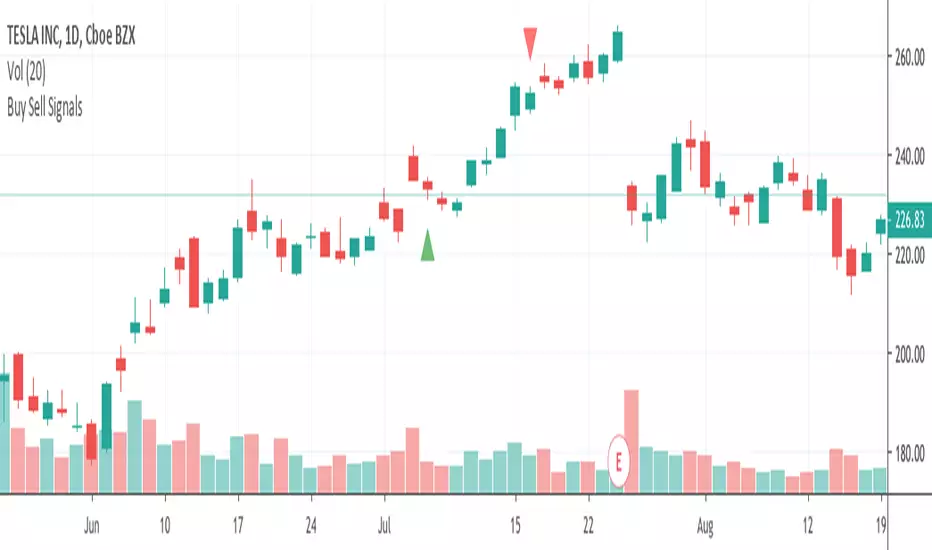
Buy Sell SignalFinding the highest winning percentage trade.
Work best on stock (1D time frame).
Only be available for a month.
If you like it, please message me
Buy Sell Signals 1Finding the high winning percentage trade signals.
It will be public for a month.
If you like it, please message me

Buy Sell SignalsFinding the high winning percentage trade signals.
It will be public for a month.
If you like it, please message me
Buy Sell SignalsFinding the high winning percentage trade signals.
It will be public for a month.
If you like it, please message me

Buy Sell SignalsFinding the high winning percentage trade signals.
It will be public for a month.
If you like it, please message me

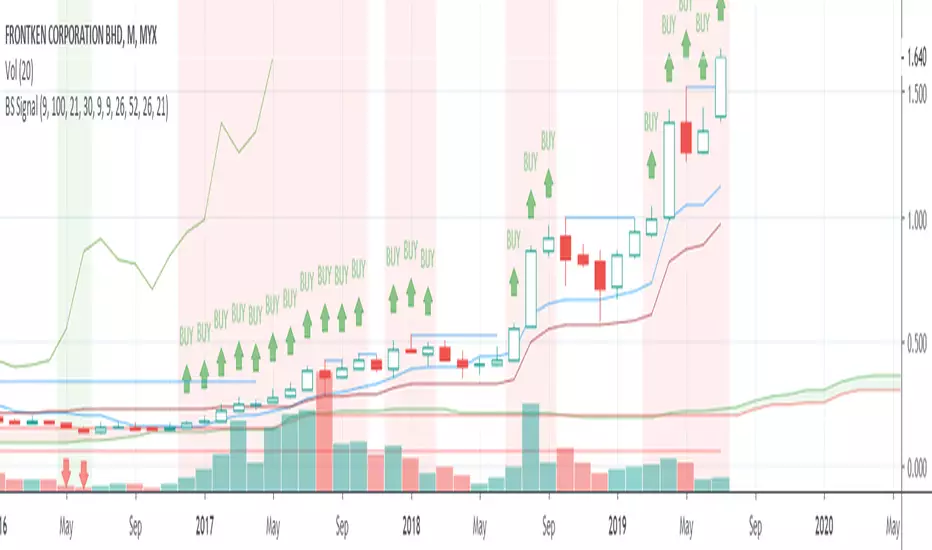
Buy Sell Signal & IchimokuThe script totally based on technical analysis. Indication of "Buy" will appear once the conditions are matched. Please don't follow "Buy" indication if it appear at top of chart.
Yellow candle is a pre-alert for any momentum coming together with increasing of price.
Yellow circle at volume bar is to show that the momentum was there.
Orange line is support & resistance.


Buy SellKıvanc hocanın yazdığı 2 stop loss indikatörünün birleşmesi sonucu bulundu. Çalışma mantığını kullandıkça anlayacaksınızıdır.


Buy Sell signal by Spicytrader
Get on board before going to the moon !
Spicytrader instantly identifies when a potential pump or dump is beginning.
Compatible with Autoview bot
GET ACCESS : spicytrader.com


Buy/Sell Ahmed Rashiedtrade with confidence good for both intra day and long term took me 2 yrs to finish it


Dragon Smart Detector [Sentiment & Flow HUD]Dragon Smart Detector is a professional-grade contextual analysis tool designed to answer the most critical questions in trading: "Is the market driven by Fear or Greed?", "Is Smart Money stepping in?", and "Is the current breakout genuine?".
Instead of lagging indicators or simple buy/sell arrows, this tool provides a Head-Up Display (HUD) that analyzes the internal dynamics of price and volume in real-time.
1. 🧠 How It Works (The Core Logic)
This indicator combines technicals and fundamentals into four distinct metrics:
A. Market Sentiment (The Mood)
Quantifies crowd psychology using a hybrid algorithm of RSI (14) and Bollinger Bands.
EXTREME FOMO 🔥 (Red): Price is overextended beyond the upper band with high RSI. Indicates the crowd is euphoric. Risk Level: High.
EXTREME FEAR 😱 (Cyan): Price is panicking below the lower band with low RSI. Often marks a potential reversal bottom (Capitulation).
GREED / ANXIETY: Intermediate states of the market.
B. Volume Winner & Flow (The Battle)
Since accurate "Order Flow" data is not universal across all feeds, this script uses Price Spread Analysis to estimate aggressive pressure.
BULLS: Close price is near the High of the candle $\rightarrow$ Accumulation/Buying Pressure.
BEARS: Close price is near the Low of the candle $\rightarrow$ Distribution/Selling Pressure.
Flow Display: Shows the estimated percentage of Buying vs. Selling volume for the current session.
C. Volume Strength (RVOL)
Relative Volume compares the current volume against the 20-period simple moving average.
1.0x: Average volume.
> 2.0x (Orange): Volume is double the average. Significant activity.
> 3.0x (Pink/Magenta): Institutional Activity. Massive volume spike indicating Smart Money participation.
D. Float Rotation (The "Dragon" Metric)
Calculates what percentage of the company's available shares have been traded today.
Smart Data Fetch: The script automatically attempts to load FLOAT_SHARES. If unavailable (common with ETFs or some Indices), it intelligently switches to TOTAL_SHARES as a backup.
Why it matters: High rotation (e.g., > 2%) accompanied by a price increase suggests a massive changing of hands, often validating a strong breakout.
2. 🎯 How to Trade (Strategy Guide)
Scenario 1: The "Dragon Breakout" (Momentum)
Condition: Price is breaking a key resistance level.
Check HUD:
WINNER: Must be BULLS.
VOL STRENGTH: Should be > 1.5x (Orange) or > 3.0x (Pink).
ROTATION: High rotation confirms the breakout is supported by fresh demand.
Action: Enter the trade with confidence.
Scenario 2: The "Capitulation Buy" (Reversal)
Condition: Price is dropping sharply.
Check HUD:
SENTIMENT: Must show EXTREME FEAR 😱 (Cyan).
WINNER: Wait for the "Winner" status to flip from BEARS to BULLS (indicating a wick/rejection of lows).
Action: Look for long entries or reversal patterns.
Scenario 3: The "FOMO Trap" (Risk Management)
Condition: Price is rallying, but you are late to the party.
Check HUD:
SENTIMENT: Shows EXTREME FOMO 🔥.
FLOW: Shows BEARS winning (selling into strength/wicks).
Action: Do NOT buy. Tighten stop-losses or take partial profits.
3. ⚙️ Settings & Features
Smart Backup Data: Automatically handles N/A data for NASDAQ/NYSE tickers (like TSLA, NVDA) by switching data sources.
Manual Float: Allows you to manually input share count (in Millions) for penny stocks or local markets where data is missing.
Minimalist Mode: Hides Fundamental rows (Float/Rotation) if you only want to see Sentiment and Flow.
Visuals: Modern Neon/Borderless interface designed for dark mode charts.
Disclaimer
This indicator is for educational and informational purposes only. "Volume Flow" and "Winner" are estimates based on Price Action logic, not Level 2 data. Fundamental data relies on TradingView's financial database. Past performance does not guarantee future results.
Tip: Add this to your favorites ⭐️ and boost 🚀 if you find it useful in your daily trading!

Malama's Quantum FusionOverview
Malama's Quantum Fusion is an advanced, unified trading indicator that builds upon and significantly extends the core concepts from "Malama's Quantum Swing Modulator" (MQSM). It intelligently fuses swing-based probability zones with a full reversal signal engine, multi-layered trend confirmation, regime detection, and optional multi-timeframe (MTF) alignment. Signals are generated only when multiple independent systems converge, resulting in higher-conviction setups with reduced false signals in ranging or choppy conditions.
The system combines:
Probability Zones — Swing pivots, ATR uncertainty bands, and weighted scoring from oscillators (RSI, MFI), volume, price deviation, and regime-adjusted momentum.
Reversal Signal Engine — Precise candle pattern detection requiring alignment with EMA structure and a dual Supertrend cloud, plus customizable filters.
Final qualified signals demand strict confluence: reversal pattern + high-probability zone proximity (optional) + trend cloud + filters + optional MTF trend confirmation.
Key Features
Uncertainty Zones: ATR-shaded bands around a central EMA wave for market context.
Trend Cloud: Dual Supertrend (fast/slow) fill visualizing bullish/bearish/mixed states.
Dynamic S/R Lines: Auto-drawn from EMA crosses, extending forward until price invalidation (close beyond level).
Comprehensive Dashboard: On-chart table displaying regime (Trending/Ranging/Choppy via ADX/DMI), cloud status, detailed support/resistance analysis (price, probability %, confidence %, action), MTF status, RSI/MFI, volume spike, ATR, and current signal.
Visual Signals: Diamond labels (◆ BUY / ◆ SELL), bar coloring, dynamic stop-loss lines (candle extremes), and 2:1 risk-reward target lines.
Multiple Alerts: For qualified/raw signals, high-probability zones, regime shifts, and cloud flips.
Differences from Malama's Quantum Swing Modulator (MQSM)
MQF incorporates the foundational probability zone and superposition scoring logic from MQSM but evolves it into a complete trading system:
Signal Generation: MQSM focuses solely on zone analysis and probability scoring (no actual BUY/SELL signals). MQF adds a dedicated reversal engine with candle patterns, strict filters (volume spike, ADX chop avoidance, max candle range), and requires zone alignment for signals.
Trend & Structure Enhancements: Adds fast/slow EMA structure, dual Supertrend cloud for visual trend bias, dynamic extending S/R lines from EMA crosses, and optional MTF Supertrend/ADX confirmation.
Expanded Dashboard: MQSM's table is simpler (support/resistance levels with prob/confidence/action). MQF's unified dashboard includes regime, cloud, MTF, oscillators, volume, ATR, and live signal status.
Additional Filters & Regime Handling: More granular ADX thresholds (trend/chop), volume spike integration into confidence scoring, and cloud alignment bonuses.
Visual & Risk Aids: MQF provides signal labels, bar colors, SL/target lines, and pivot plotting options not present in MQSM.
In essence, MQSM provides contextual zone analysis for manual decision-making, while MQF delivers automated, confluence-based entry signals with richer visuals and risk guides.
How to Use
Context First: Monitor regime, cloud, and zone probabilities to avoid low-quality environments.
Zone Setup: Look for price nearing high-probability support/resistance (ideally >60–75%).
Signal Execution: Wait for qualified ◆ BUY/SELL diamonds—only fired on full alignment. Use plotted SL and 2:1 targets as starting points.
Customization: Tune filters (e.g., enable MTF for higher timeframes, adjust zone probability threshold) to suit scalping, intraday, or swing trading.
Best on 15m–4H timeframes across stocks, forex, crypto, or futures.
Disclaimer
This indicator is for educational and informational purposes only. It is not financial advice. Past performance does not guarantee future results. Always use proper risk management and combine with your own analysis. Trading involves substantial risk of loss.
